
the platform to contextualise
and analyse your data
Mapping, indicators, dashboards
Transform your data into clear analyses, tailored to your challenges and immediately actionable
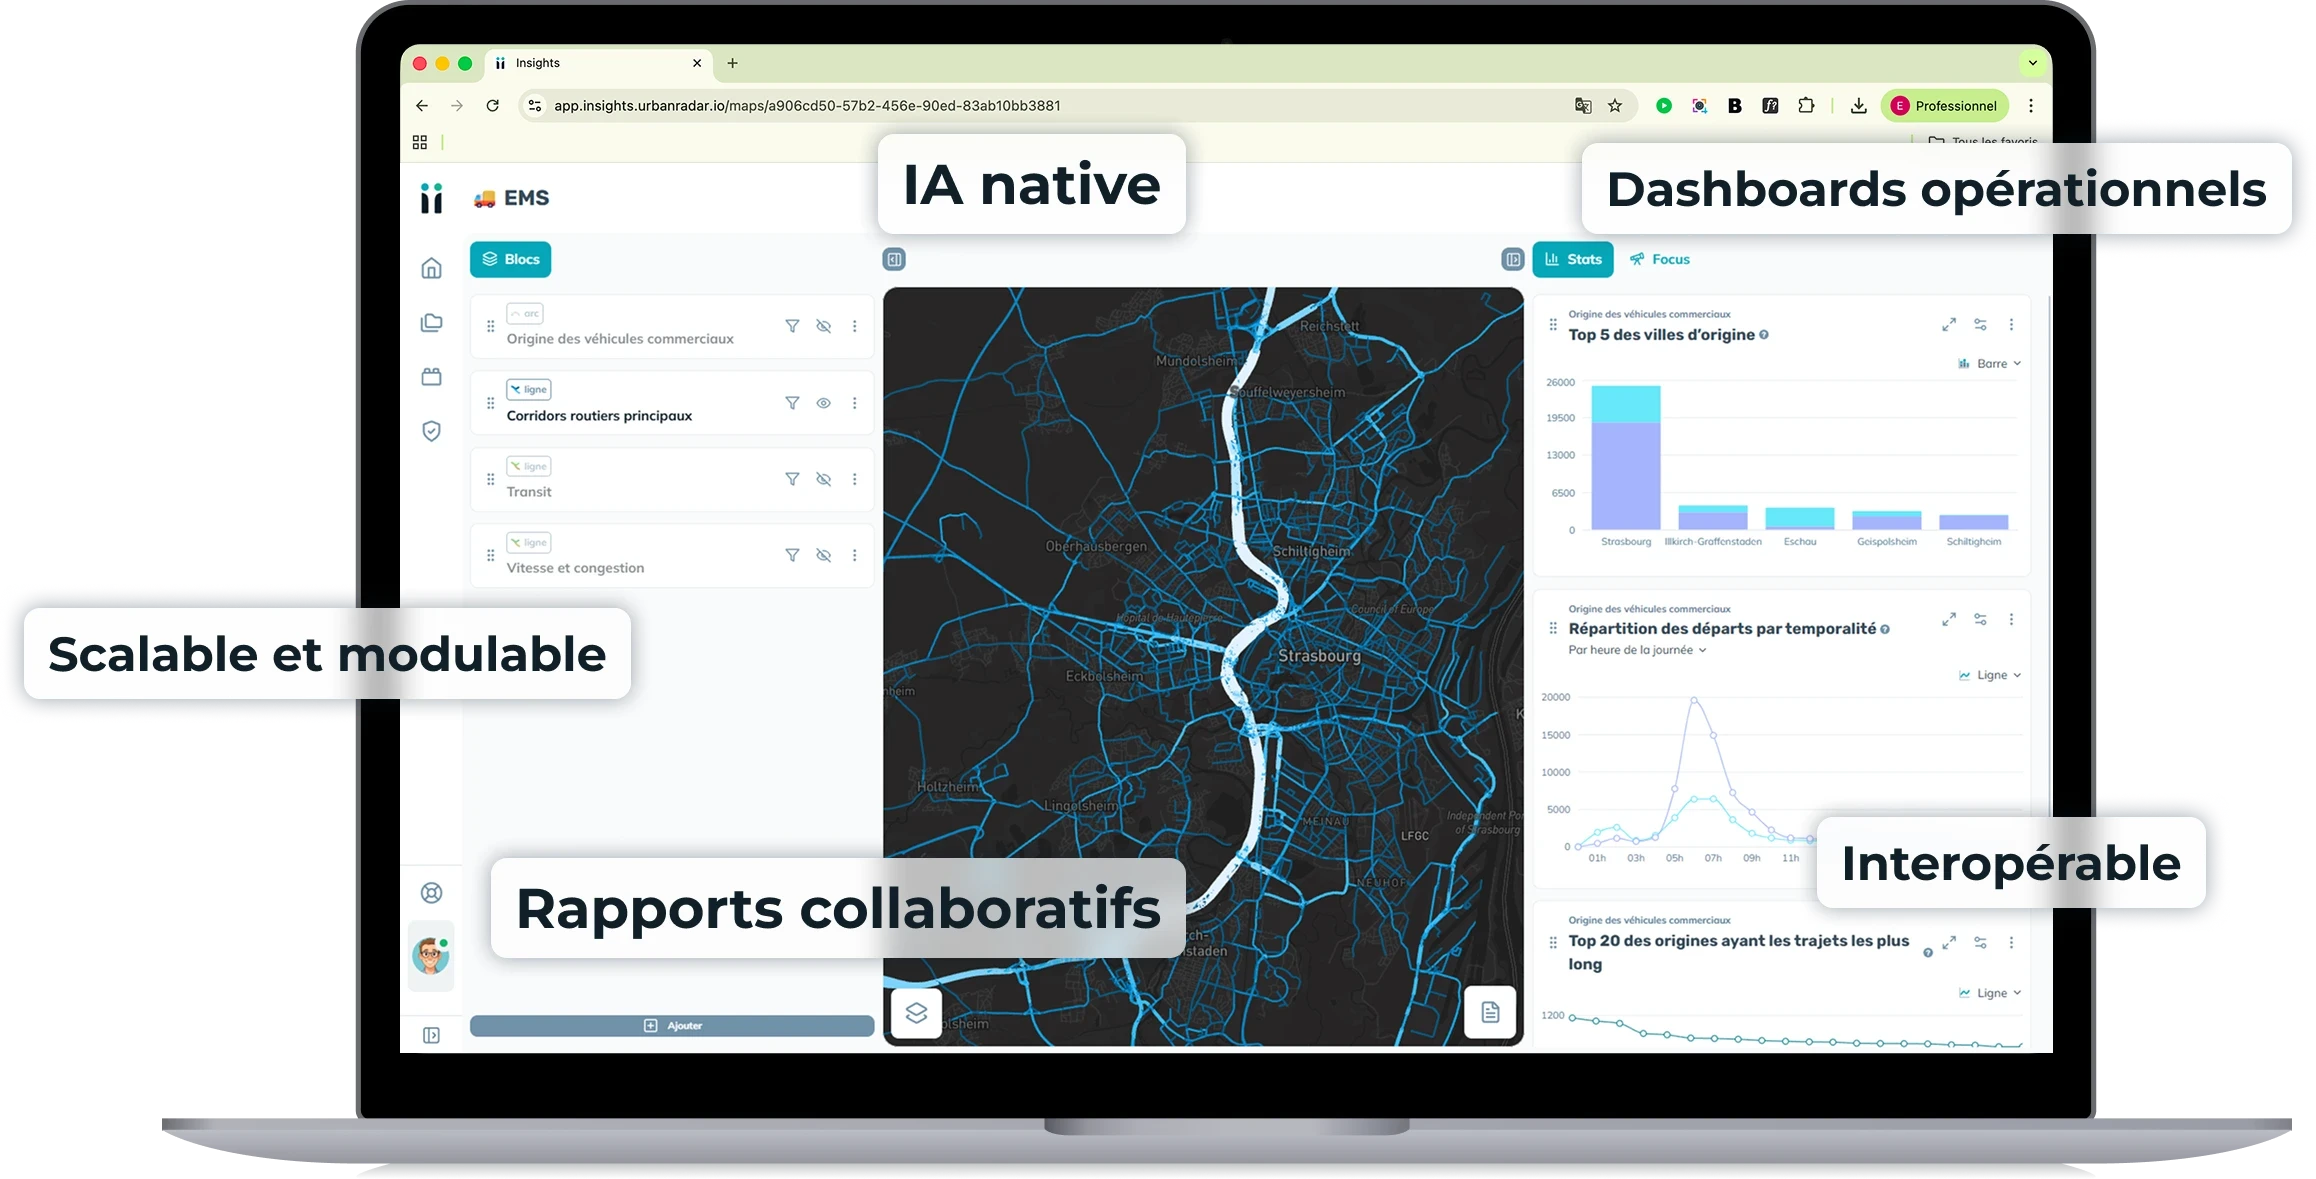
the insights platform is designed for business decision-makers
Four simple steps to transform data into decisions
01
Select and structure the data
Identify key variables to observe, combine relevant sources and build your analysis base.
Easily organise multi-source data
Cross-reference flows and business indicators
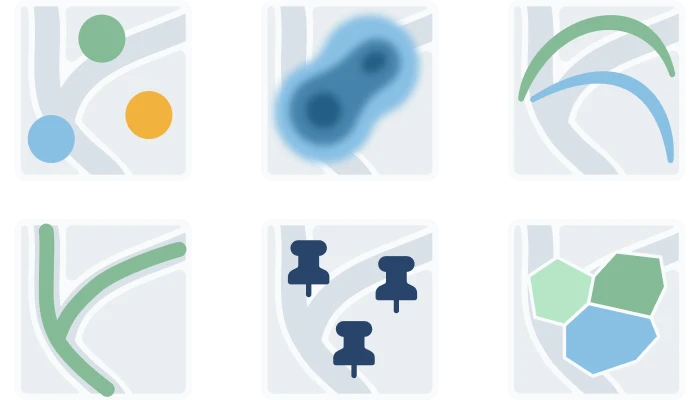
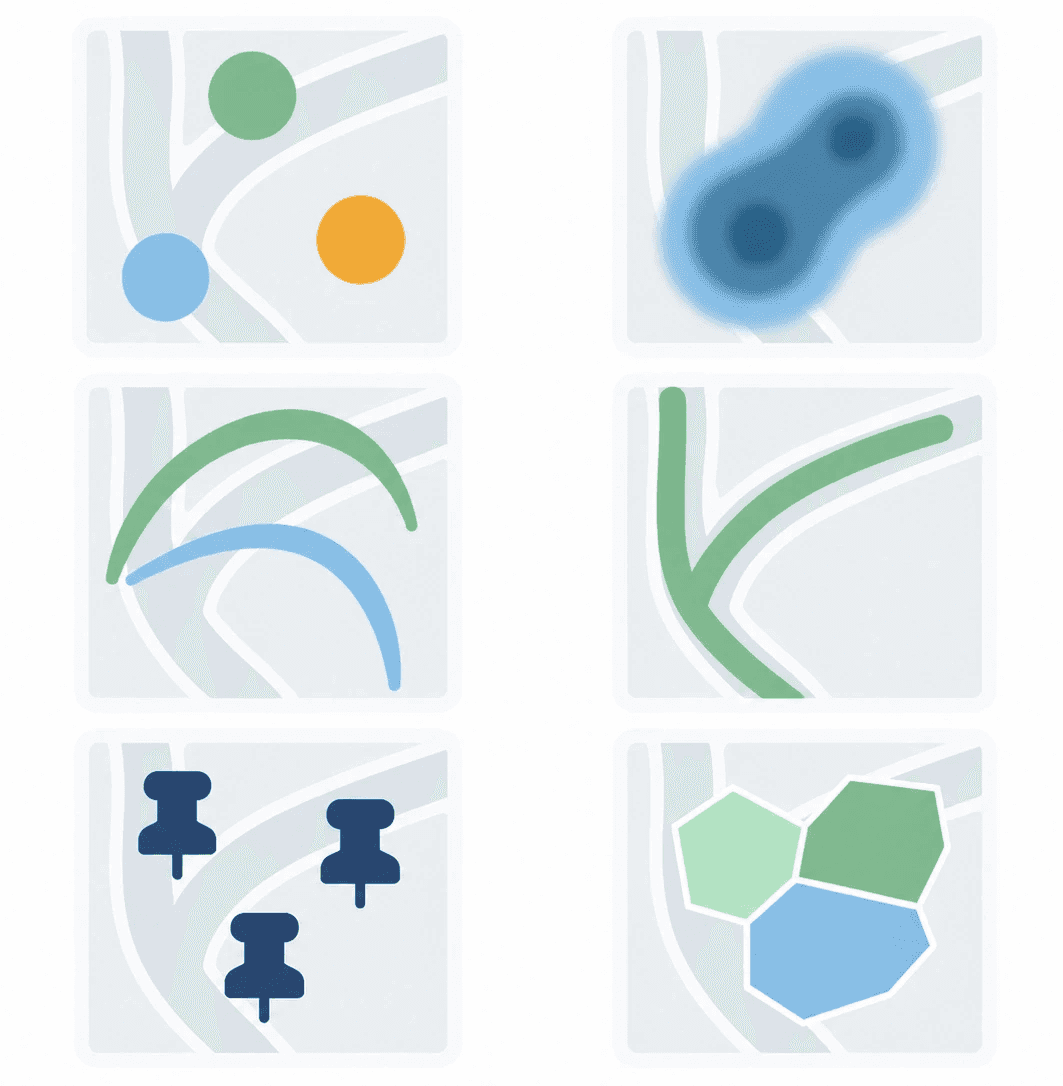
Choose the representation formats tailored to your needs
01
Select and structure the data
Identify key variables to observe, combine relevant sources and build your analysis database.
Easily organise multi-source data
Cross-reference flows and business indicators
Choose the representation formats tailored to your needs
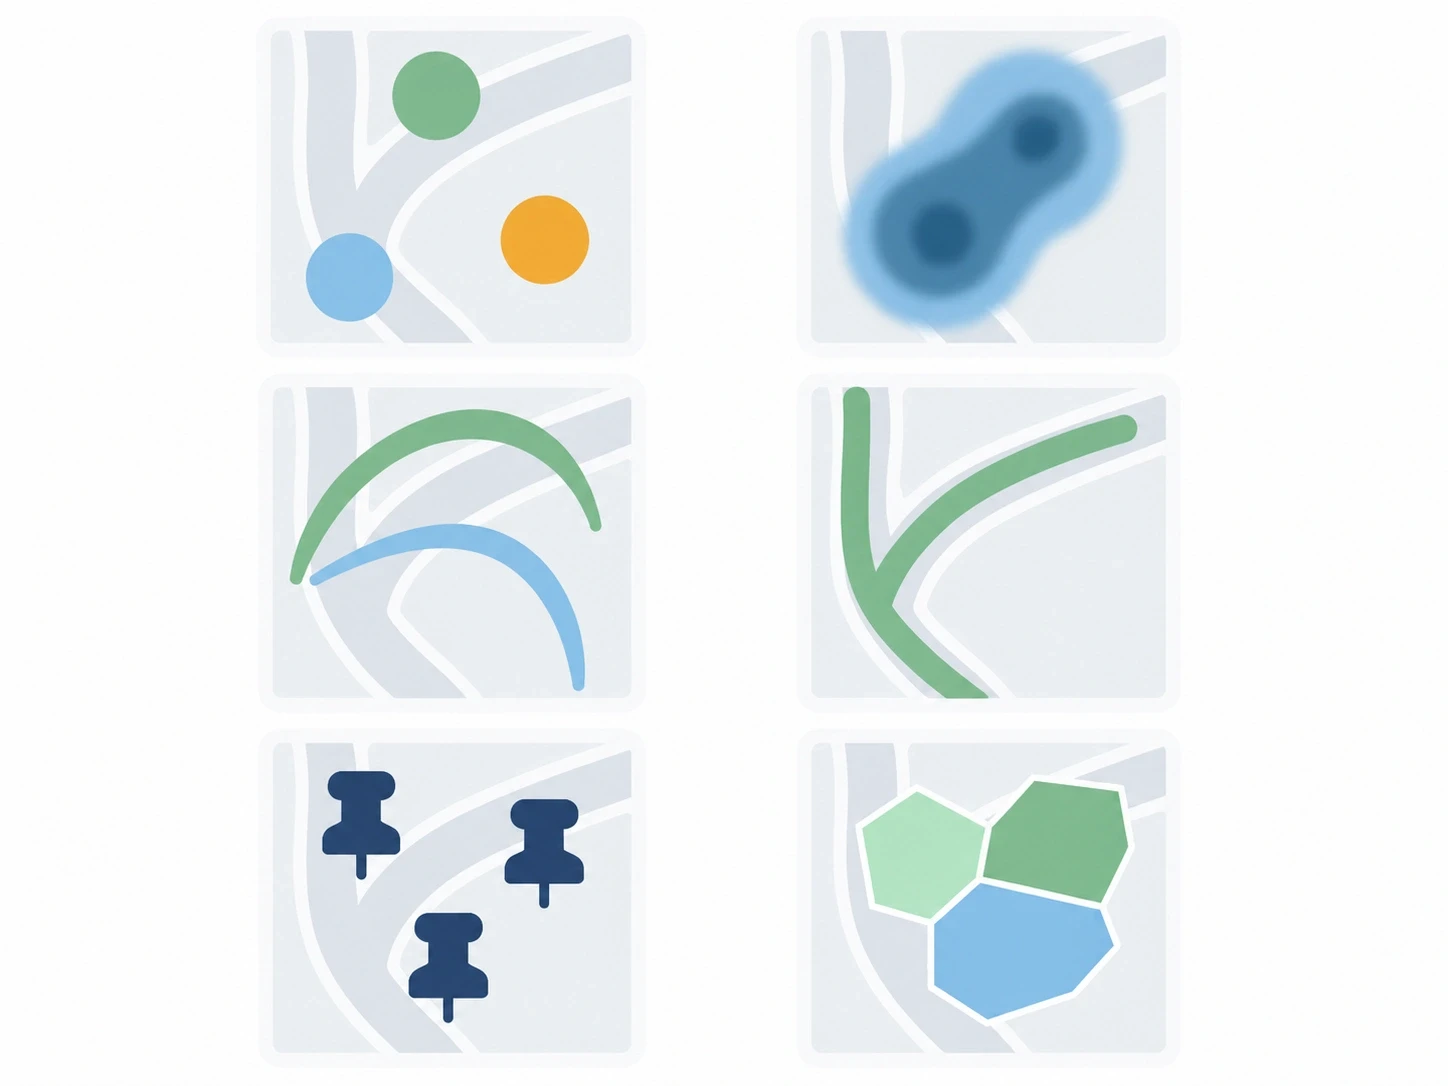
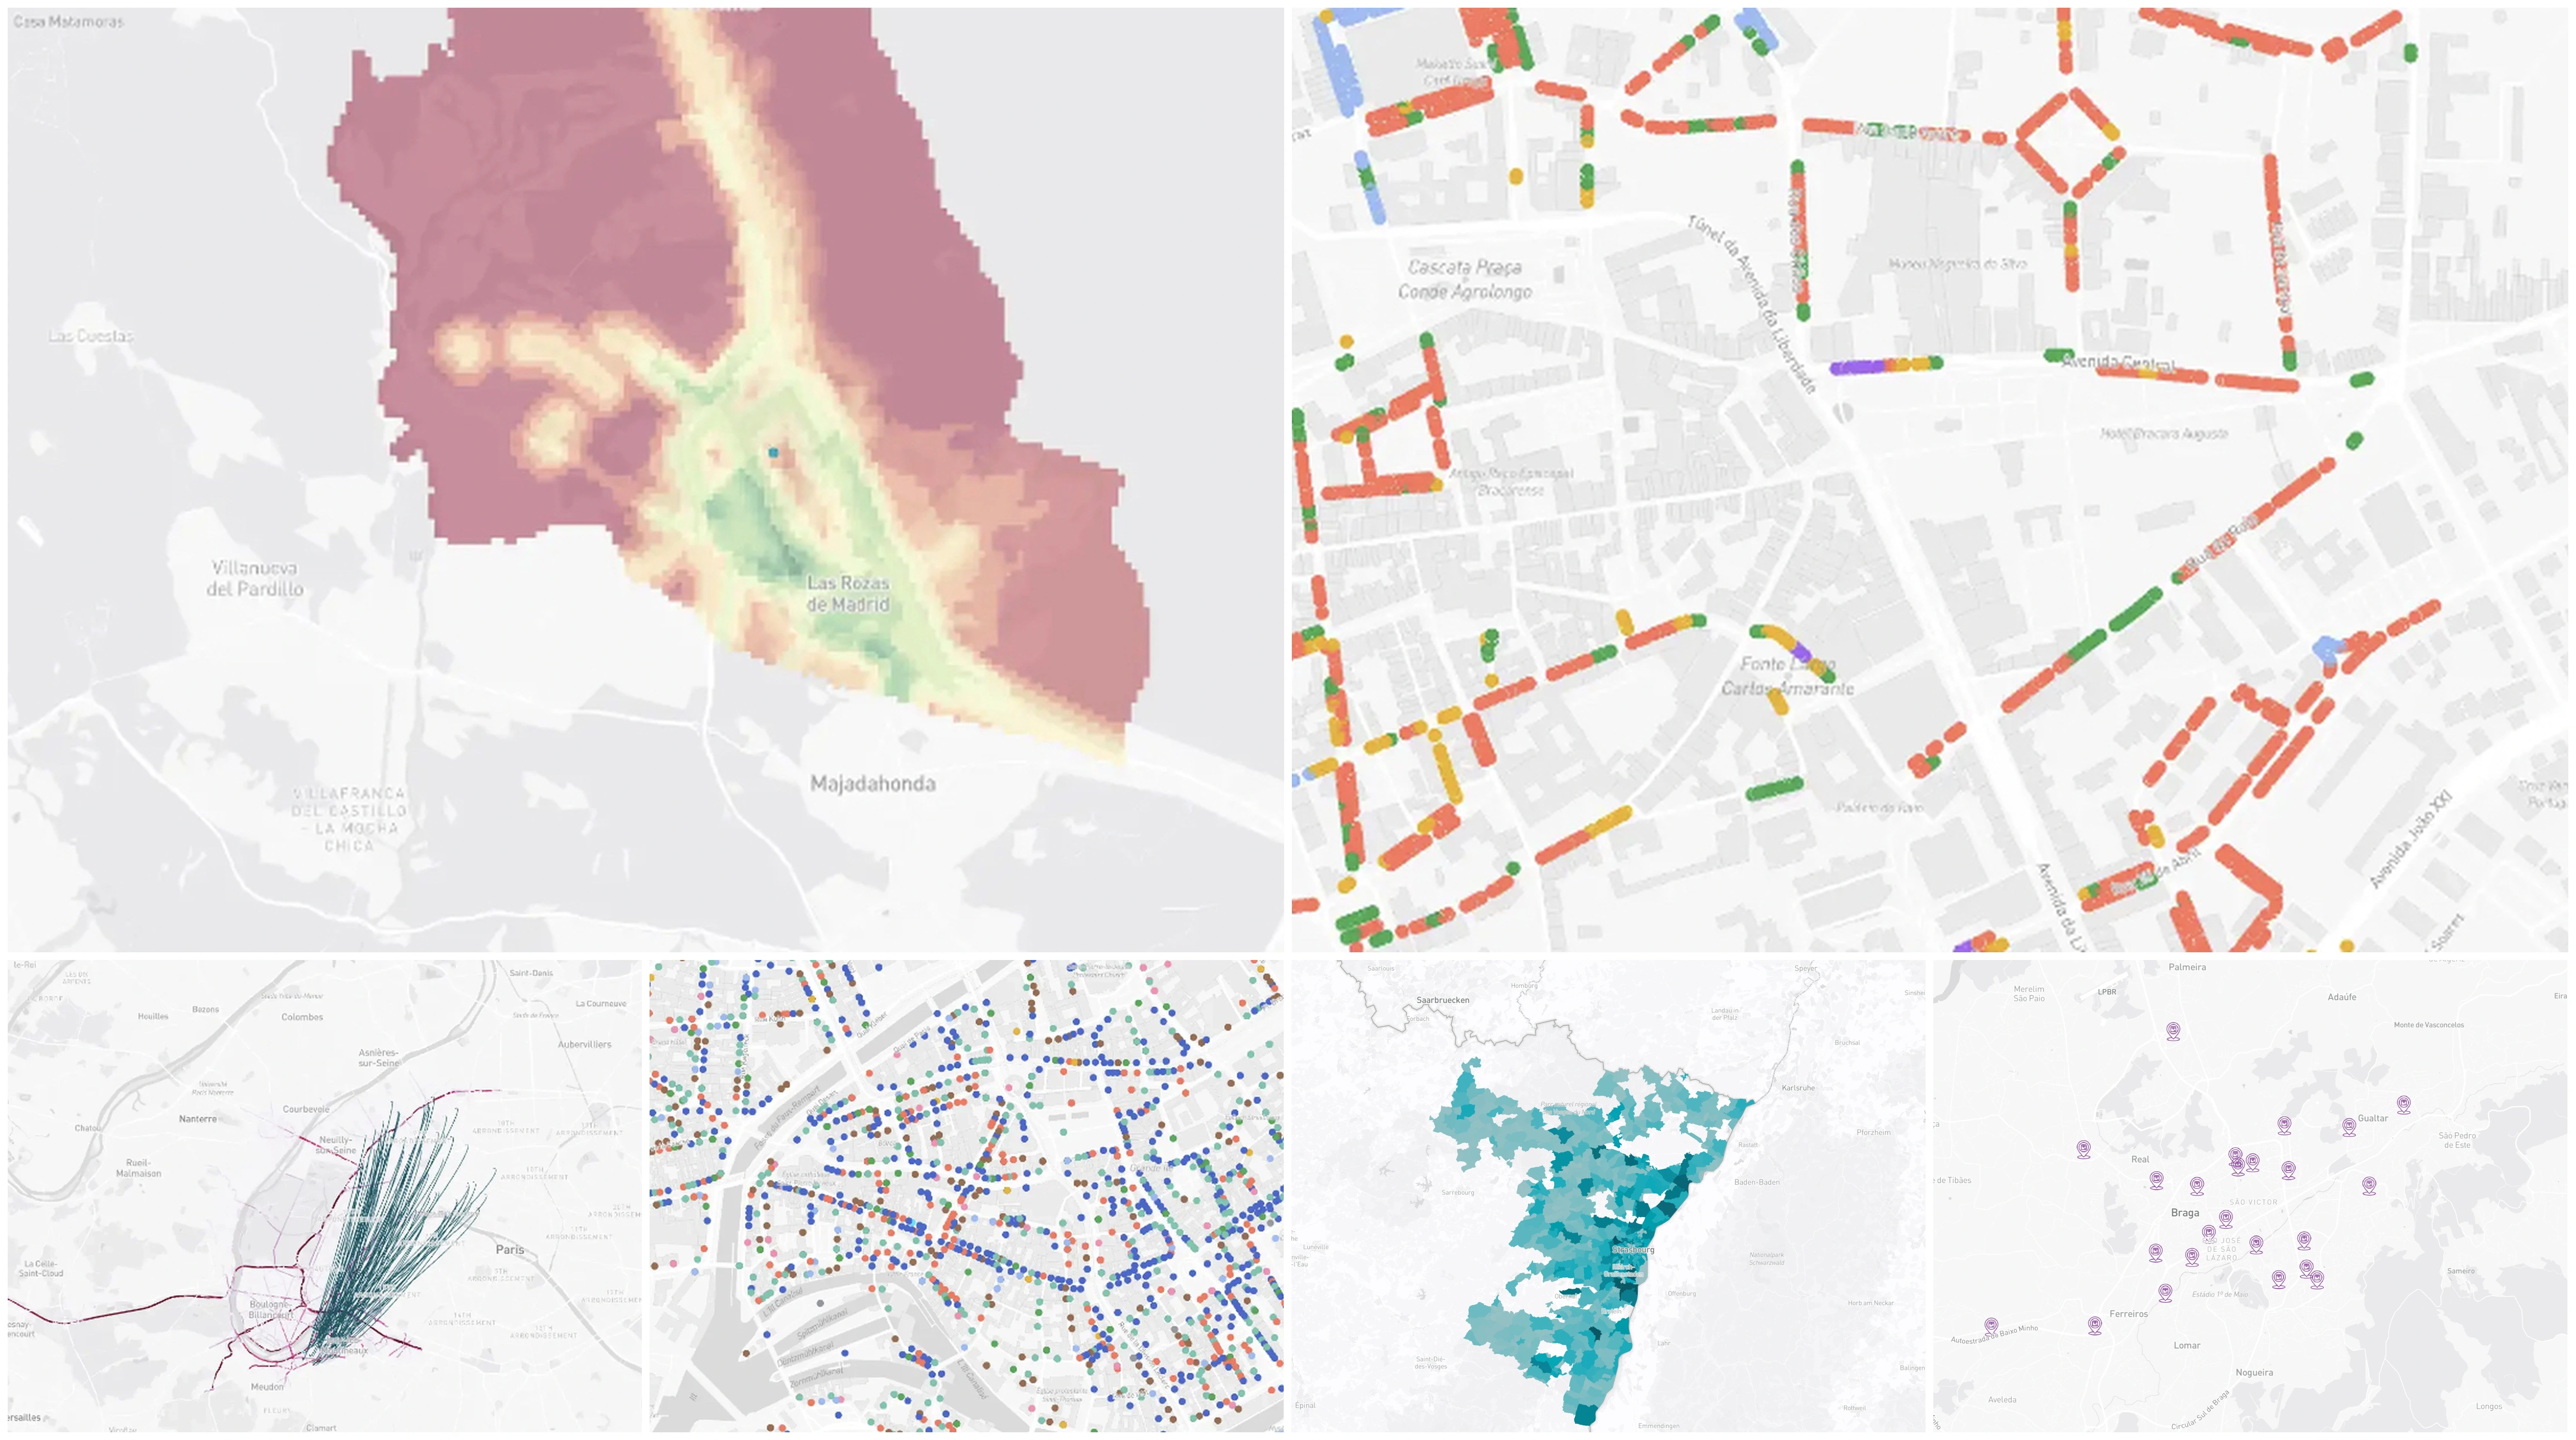
Polygon
Points
Line
Bow
Heatmap
Icon
Points

Polygon
Points
Line
Bow
Heatmap
Icon
Points
02
Visualise flows and dynamics
Get an immediate visual reading to understand the real dynamics of the observed area:
Identify areas of concentration
Explore structural axes
Observe trends
Compare periods
Detect an anomaly or a point of tension
The Insights platform is modular and adapts to your decision-making context: colour palettes, advanced filters, customisable thresholds.
02
Visualise the flows and dynamics
Polygon
Points
Line
Bow
Heatmap
Icon
Points
Polygon
Points
Line
Bow
Heatmap
Icon
Points
Get an immediate visual reading to understand the real dynamics of the observed area:
Identify concentration zones
Explore structuring axes
Observe trends,
Compare periods,
Detect an anomaly or a point of tension
The Insights platform is modular and adapts to your decision-making context: colour palettes, advanced filters, customisable thresholds.
03
Explore and analyse flows based on multi-dimensional criteria
Refine your analyses and decisions by combining several dimensions:
Fine temporal analysis (comparisons by period, developments and trends, temporal filters)
Advanced spatial analysis (isochrones and distances, origin / destination / stop, administrative perimeters)
Categorical and quantitative analysis (textual and numerical filters, groupings by attribute, comparative indicators)

03
Explore and analyse flows according to multi-dimensional criteria
Refine your analyses and decisions by combining several dimensions:
Detailed temporal analysis (comparisons by period, developments and trends, temporal filters)
Advanced spatial analysis (isochrones and distances, origin / destination / stop, administrative boundaries)
Categorical and quantitative analysis (text and numerical filters, groupings by attribute, comparative indicators)

Time series
Filters
KPI
04
Measure, test, manage
Statistics are synchronised in real time to measure the impact of your decisions:
Measure volumes and variations, durations and averages, and make temporal comparisons
Test your hypotheses and immediately observe their impact
Guide your strategic decisions with subtlety and precision thanks to dynamic KPIs
Statistics are synchronised in real time to measure the impact of your decisions:
Measure volumes and variations, durations and averages, and make temporal comparisons
Test your hypotheses and immediately observe their impact
Guide your strategic decisions with subtlety and precision thanks to dynamic KPIs
04
Measure, test, steer
Statistics are synchronised in real time to measure the impact of your decisions:
Measure volumes and variations, durations and averages, and make temporal comparisons
Test your hypotheses and immediately observe their impact
Steer your strategic decisions with subtlety and precision thanks to dynamic KPIs
Time series
Filters
KPI
Time series
Filters
KPI
Infrastructure and performance
The perfect alliance between technological power and simplicity of use
High performance
Optimised calculation engine Large-volume processing Native AI (anomaly detection, predictive indicators...)
High performance
Optimised calculation engine Large-volume processing Native AI (anomaly detection, predictive indicators...)
APIs & Integrations
Open APIs & connector Multi-zone & real-time
APIs & Integrations
Open APIs & connector Multi-zone & real-time
Business use
Easy to get started Available in several languages Modular and customizable interface
Business use
Easy to get started Available in several languages Modular and customizable interface
SaaS mode
100% web-based, no installation required Immediate availability
SaaS mode
100% web-based, no installation required Immediate availability
Compliance and Security

Access control
Management of roles and permissions Access traceability Segmentation of client environments European coverage
Access control
Management of roles and permissions Access traceability Segmentation of client environments European coverage

Data protection
Secure cloud hosting Anonymised and aggregated data Encryption of data at rest and in transit High availability
Data protection
Secure cloud hosting Anonymised and aggregated data Encryption of data at rest and in transit High availability

Regulatory compliance
Compliance with GDPR and regulatory requirements in force
Regulatory compliance
Compliance with GDPR and regulatory requirements in force
Access control
Management of roles and permissions Access traceability Segmentation of client environments European coverage
Data protection
Secure cloud hosting Anonymised and aggregated data Encryption of data at rest and in transit High availability
Regulatory compliance
Compliance with GDPR and regulatory requirements in force
Let's go further together
Let’s see how stream data can improve
your operations
Discover how the platform adapts to your context